Getting back into NumPy, Day 3
Today we’re pushing on with the heat maps. I still don’t have much data to analyze, but as I continue with the 100 day challenge, the data will more or less collect itself.
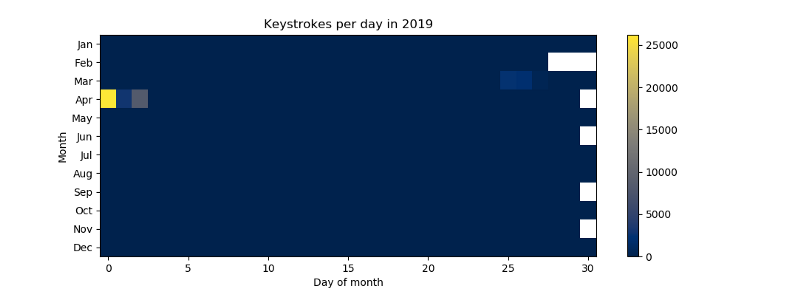
So far I have a graph showing my distribution over the day, and one graph showing a heat map with the activity since the day I started. Next step is a heat map over the whole year. With this graph I can then see how my activity has changed over the year. And it introduces a small problem that I need to solve.
A day always have the same amount of minutes in it (modulo strange days with leap minutes and leap seconds), but this isn’t the case with months. And if I take the naive route and just try to add the groupings to the dataframe, I get the following error:
ValueError: Length of values does not match length of index Why is this? The columns of my dataframe are 31 days, 28 days, 30 days, and so on long. And just adding them with the same method (dataframe[index]) doesn’t work since it seems that Pandas expects columns of the same length.
Thanks to an answer on StackOverflow, I managed to solve this problem fairly easy, using Pandas concat function.
One small thing also needed some attention. Doing the second grouping in the naive way, using dataframe.index.day, yielded a strange error:
ValueError: Grouper and axis must be same length I’m still not quite sure why this error showed up, but the solution was simple. Do the sorting with a lambda instead, and reference the day-property of the anonymous variable.
And of course, just as yesterday, I need to extend the data frame with zeros so that there is data available for a full year.
All in all: here’s the full code for this heat map.
# Heatmap for whole year
min_date = df.index[0]
max_date = df.index[-1]
start_of_year = datetime.datetime(min_date.year, 1, 1, 0, 0, 0, 0)
end_of_year = datetime.datetime(max_date.year, 12, 31, 23, 59, 0, 0)
df.at[start_of_year, 'strokes'] = 0
df.at[end_of_year, 'strokes'] = 0
upsample_year = pd.DataFrame()
upsample_year = df.resample('min').asfreq().fillna(0)
upsample_year.index = pd.to_datetime(upsample_year.index)
groups = upsample_year.groupby(upsample_year.index.month)
year = pd.DataFrame()
for month, group in groups:
    # Don't just add them together, this will create an error.
    # Concat the dataframes instead. Remember Axis 1.
    year = pd.concat([year, group['strokes'].groupby(lambda x: x.day).sum()], axis=1)
plt.imshow(np.transpose(year), interpolation=None, aspect='auto', cmap="cividis")
plt.title("Keystrokes per day in 2019")
plt.xlabel("Day of month")
plt.ylabel("Month")
plt.yticks(np.linspace(0, 11, 12), ["Jan", "Feb", "Mar", "Apr", "May", "Jun", "Jul", "Aug", "Sep", "Oct", "Nov", "Dec"])
plt.colorbar()
plt.show()
This yields the following beautiful picture with mostly zero values. But it’s good to know it will fill itself over the year :-)

As a note: I’m using the colormap “Cividis” since the colormap “Hot” made the days with the highest entries indistinguishable from days without entry (both turn out white), and I’m transposing the matrix to make the graph lengthy instead of tall. Everything for readability and beauty!
