Getting back into NumPy, Day 1
Have you ever had something that you’ve procrastinated with for far too long? I have, and that is getting back into programming with Python and NumPy. Well, having some free time this week I’ve decided to start my own #100daysofcode to get started.
This is my journal, day one. Goal: using Pandas and Numpy to put out some nice graphs of my keystroke logging. I’ve just started logging the amount of keystrokes I make.
First things first: the logging is made with the software minute, a keystroke counter for Mac OS X. It is minimal, seems to be safe (I checked the source code), and the only thing it generates is a log file of the following format:
minute,strokes
1553628300, 81
1553628420, 103
1553628600, 58
1553629500, 58
....
The first entry is a Unix timestamp, the second entry is the number of keystrokes made during that minute (technically the minute before, but this isn’t important for now). Minute only makes entries for minutes when keys have been pressed.
How do I get this data into Pandas? Well, pd.read_csv() to the rescue! The only code needed is this:
def parse_date_from_time_stamp (linux_time_stamp):
    return datetime.datetime.fromtimestamp(float(linux_time_stamp))
df = pd.read_csv('./keystrokes/01.04.2019.log',
    parse_dates=True,
    date_parser=parse_date_from_time_stamp, index_col="minute")
The helper function parses the date from the time stamp (as you might have guessed from the function name).
The next step is a waste of computation time, and I only include it since I found it useful and might need it for future reference. Every minute that doesn’t have an entry is assigned the value zero. This was surprisingly easy to do using Pandas resample-functionality. Downsampling is exactly as easy!
upsample = pd.DataFrame()
upsample = df.resample('min').asfreq().fillna(0)
Now, let’s make the Datetime-entry the index of the dataframe:
upsample.index = pd.to_datetime(upsample.index)Now to our first graph. I want to see the distribution of the mean number of keystrokes per minute, so we need to group the data in some way. Turns out Pandas has a function for this as well, or at least half the functionality I need. You can natively group by minutes, hours, days, years, and so on, but there isn’t a native function to group by minute of the day.
To do this, you need a small helper function that computes the minute of the day from the date. The full code for grouping and computing is as follows:
def datetime_to_minute_of_day (datetime):
return 60*datetime.hour + datetime.minute
# Group data by minute of day
mean_strokes_per_minute_of_day = upsample.groupby(lambda x: datetime_to_minute_of_day(x)).mean()
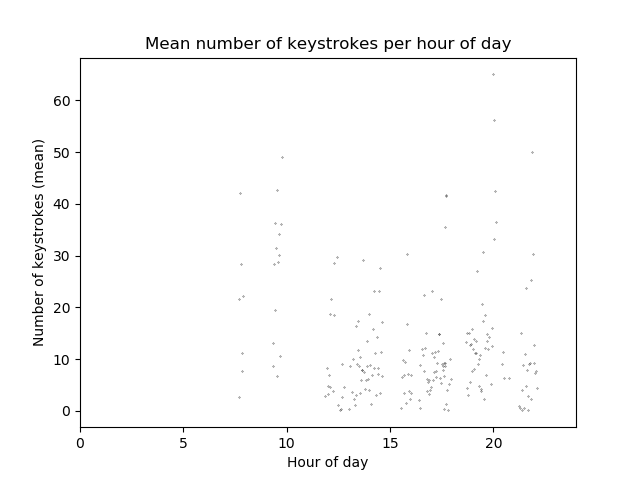
Now for the graphing. Since we have all we need this step is straightforward. For readability the y-axis has been scaled to show the hour of the day instead of minutes, and the nonzero entries have been removed (now you see why I told you that filling those empty entries with zero was a total waste of time!).
mean_strokes_nonzero_entries = pd.DataFrame()
mean_strokes_nonzero_entries = mean_strokes_per_minute_of_day['strokes'][mean_strokes_per_minute_of_day['strokes'] != 0]
# Number of strokes per hour of day
plt.title("Mean number of keystrokes per hour of day")
plt.xlabel("Hour of day")
plt.ylabel("Number of keystrokes (mean)")
# Scale x-axis by dividing by 60
plt.plot(mean_strokes_nonzero_entries.index/60, mean_strokes_nonzero_entries, 'k.', ms=0.5)
# Set limits to 0 and 24.
plt.xlim([0, 24])
plt.show()
And that’s about it. This yields a graph looking like this (roughly a week of data, from which three days were computer free):

